


[#29] Is pricing the answer to fragmenting UPI market share?


In my last article (#28) I had talked about how NPCI has extended the 30% market share cap on UPI apps deadline to the end of 2024. And while this has been happening since 2020 - where the deadlines have been getting extended, 2024 is not the end. They will probably have to extend it again, because at current trends (PhonePe at ~50%, Gpay at 35% and Paytm at 6%) capping it at 30% will severely impact customer experience. At #4 sits Cred, which is focused on the credit-carded customers. And bank apps still have a way to go to deliver the same experience that the top fintech apps offer.
But what is the bigger reason for the top 3 apps having ~92% market share? Yes, one is that Phonepe, Paytm & Gpay came into the market early, and capitalized on the early mover advantage. But another is that new apps don’t have incentives to really compete for UPI volumes because UPI has long been marketed as a “free product.” Free to the customer, and free to the merchant. And while this was one reason for its exponential adoption, it has now also hindered entry of new players. Why would a company enter this space if the only way to make money is to cross-sell financial products? And that is possibly why players such as Kiwi, Rio Money, and KreditPe are marketing themselves as CC on UPI apps, not just UPI apps. CC on UPI attracts ~2% MDR, so there is a path to monetization.
Current UPI apps have been getting around this through charging platform fees: Ex: Charge Rs 1-2 per mobile payments, upto Rs 5 for utility payments, and reportedly some charge a % of the transaction for education fee / rent payments.
In global markets, predominantly the trend is to charge the merchant, and keep it free for the end user
In global markets which have real time payment equivalents (you can check out my article on the same here), while there are exceptions, broadly, the real time account to account payment product is free for the end user, but the retailer / merchant is charged some fee. Some examples:
1. Pix (Brazil): Free for the end customer, charge between 0.22 - 0.33% to merchant per transaction. And they are scaling fast: in March ‘24, they hit 5B transactions, and reportedly have an average txn value of $80, which means they’re hitting close to $400B in transaction value per month. In comparison India is at 19 Lac Cr in April ‘24 or ~$230B.
2. Twint (Switzerland): Free for the end customer, charge 1.3% per transaction to the merchant, and some fixed charge for specific transactions which is ~0.3 CHF / transaction
3. Blik (Poland): According to Bank millennium, it is free for the end user, but merchants are charged $0.10 per transaction and $0.75 per transaction for businesses with over 2 locations.
4. Swish (Sweden): Free for end user, charges merchants 2 Kronor or $0.09 per transaction
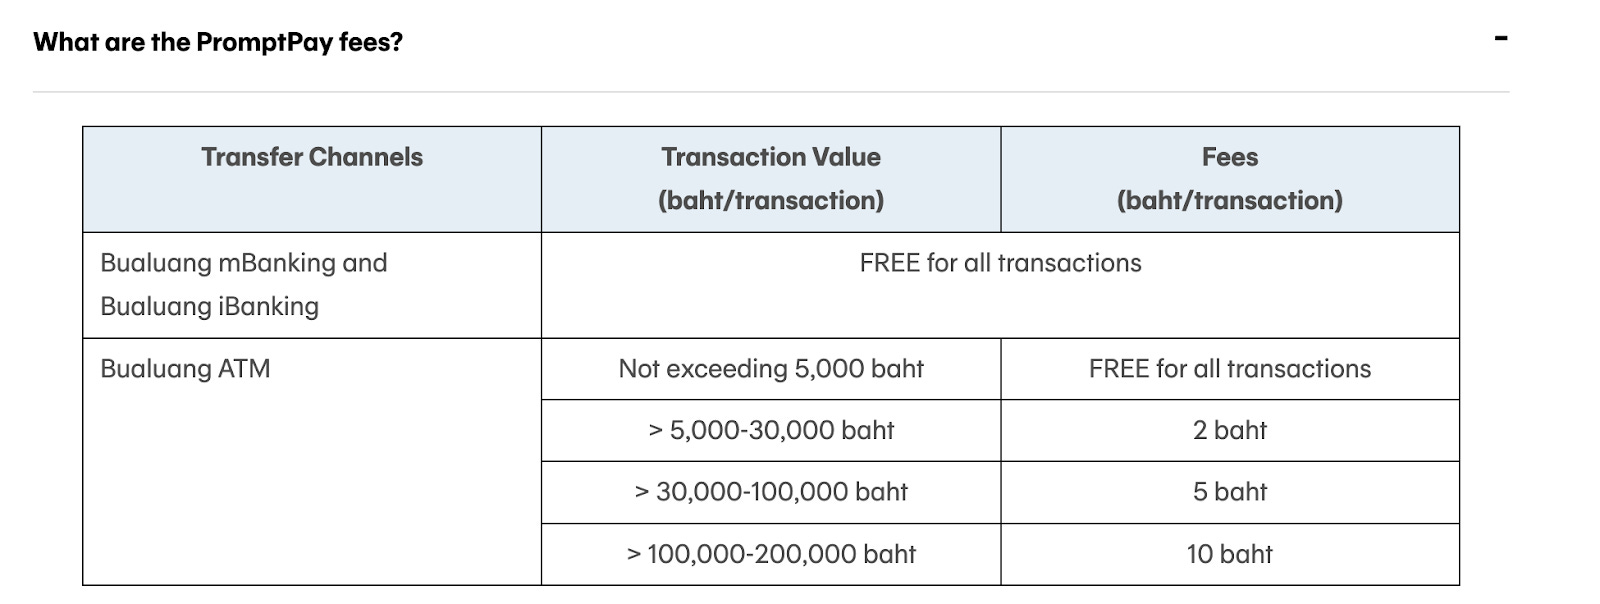
5. Promptpay (Thailand): Free for all users upto 5000 baht (this is INR ~11k, after that slab based pricing kicks in. From what I understand, the sender bears the cost, but it's not clear what the merchant charges.
6. Paynow (Singapore): Free to the end user, according to Stripe documents, there is a charge of 1.3% for merchants accepting payments through PayNow.
Here is a snapshot of Blik pricing for the end customer From Bank Millennium (a polish bank)

And here is the snapshot for the fees charged to the end customer in Promptpay (from Bangkok Bank)
Mastercard & VISA are powering the real time payments systems in multiple countries:
What is interesting though is that unlike UPI in India which is homegrown, Promptpay and PayNow are powered by Mastercard’s Vocalink. (article link here). While PLIN is powered by Yellow Pepper, which is a VISA company. So while there is a rise of local card networks by countries to reduce reliance on international card networks, Rupay in India being a prime example, and Indonesia reportedly looking to develop its own credit card network in-house) Mastercard and VISA are making their own strategic plays into building technology to power real time payments in these countries. But that’s for a separate article.
So then if we want to keep real time payments free for the end user, then by definition P2P payments have to be free, and only P2M can be charged
Note: *Peer to peer, defined here as from one individual to another, while P2M is peer to merchant, which is when a customer pays at let’s say an Amazon. Here the customer is the “peer” and the merchant is Amazon).
But is charging only P2M payments feasible? Well, let’s look at the trends in UPI.
There are two metrics we’re looking at here (and btw all this data is publicly available on NPCI’s website). It’s the value of transactions Month on Month (in Cr) and the number of transactions (in Mn)

While P2P transactions have always outstripped P2M transactions, over the last year this proportion has decreased, with P2M transactions growing faster than P2P transactions.
Let’s look at the data:
In April 2023: The total UPI transactions in terms of Cr were 14 Lac Crore. The split between P2P & P2M was 77.18% of the value in Cr sitting in P2P, and 22.82% sitting in P2M.
In April 2024: The total UPI transactions in terms of Cr was 19.6 Lac Crore. The split between P2P and P2M was: 72.97% in P2P, and 27.03% in P2M.
And then let’s look at the growth: From April ‘23 to ‘24, the growth in the value of UPI transactions has grown by 39.6%. P2P transactions grew from 10 Lac Crore to 14 lac Crore, which is ~32% growth YoY. And P2M transactions grew 3.2 Lac Crore to 5.3 Lac Crore, which is growth of ~65% YoY.
Here’s a snapshot of proportion of value of txns between P2P & P2M

So even though P2P in April ‘24 in terms of value is 3x that of P2M, this is continuing to even out as compared to April 2021, where P2P was 5x of P2M values!
The data in terms of the number of transactions is the opposite: it’s skewed more in favor of P2M transactions
In April 2023: The total number of UPI transactions was 8.8B transactions, with 43.5% of transactions coming from P2P, while 56.3% of transactions came in the P2M segment.
In April 2024: The total number of UPI transactions was 13B, with 37.5% of transactions coming in the P2P segment, while 62.5% came in the P2M segment.
And while the total number of transactions (from 8B to 13B) have grown by 62% from April ‘23 to April ‘24. And P2P has grown 3.8B to 4.9B, at a growth rate of 29%, while P2M has grown from 5B to 8.3B at a growth rate of 65%.
Here’s a snapshot of the proportion of number of transactions between P2P & P2M

Both in the case of P2P & P2M, P2M is growing ~3x faster than P2P in terms of number of transactions & value of transactions
So what are some insights from the data? Here are my inferences:
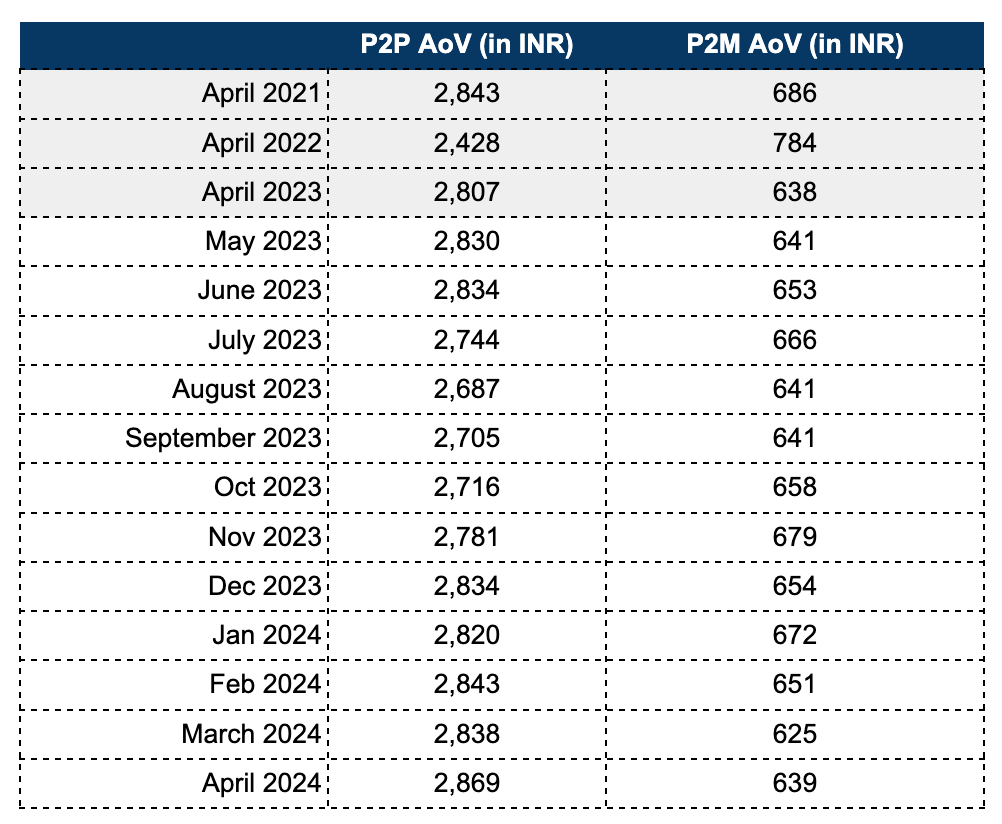
1) P2M has lower AoV due to small ticket cash transactions going digital: P2M volumes (i.e. number of transactions) are much higher, but volumes are lower: This is probably because the market of cash transactions, which are smaller ticket sizes are opening up. And the data shows this as well: P2M AoV is ~ Rs 640, while P2P AoV is Rs ~2800. This is the category of merchants called P2PM (peer to peer - merchant) which are usually in the unorganized segment: kirana, stationary, and dairy, and even things such as utilities and bill payments going to P2M
2) P2P has higher AoV probably due to rent payments: Rent payments are P2P payments, which are usually > Rs 10,000 which I suspect is what skewing the P2P AoV. The AoV numbers between P2P & P2M have stayed fairly consistent from 2021 to 2024. Here’s the data:
So atleast by this data, just looking at growth, the constraint of only being able to price the merchant, or in this case P2M transactions volume / value does not really seem to be a blocker.
But that’s the overall P2M market: There is a big segment that falls within the P2PM segment, which the NPCI will not charge. Is charging only P2M still feasible?
Let’s look at the NPCI definition of P2PM merchants first:
“P2PM is the NPCI classification for small businesses which have a projected monthly inward UPI transaction of less than or equal to Rs 50,000.”
These are the merchants who will be the most price sensitive, and if charges are brought on UPI payments, which they then have to bear, will revert back to cash payments. And that’s how NPCI has created the existing pricing construct on PPI on UPI payments (using wallets to do UPI payments), which is 1.1% on payments greater than Rs 2000. This pricing is not applicable on P2P or P2PM merchants (link here)
The cost of the UPI ecosystem is Rs 6384 Cr per annum at current volumes, so the P2M volumes excluding P2PM need to be able to generate at least this much revenue
But then what powers the ecosystem? Something has to. According to this article, the cost of each UPI transaction is close to 40p or Rs 0.4. Scale that up to the 13.3B transactions per month that UPI is seeing, and that is a monthly cost of Rs 532 Cr. Which is a cost of Rs 6384 Cr per annum to maintain the UPI ecosystem!
Lets look at the volumes by transaction value bucket
Just basis the data from April ‘22 to ‘24, the value (in Cr) of P2M transactions is growing in the > Rs 2000 bucket. While the number of transactions are actually reducing in the Rs 2000 bucket. (data snapshot below)
Why is the Rs 2000 bucket important? It’s because this could be used as a proxy for P2M merchants (while I agree, enterprise merchants like Zomato have an AoV of ~Rs 400, Meesho is reportedly ~Rs 500, and Amazon is between Rs 1.5 - 2.5k), I think we can all agree that as a rule of thumb, most of the transactions that are happening in the > Rs 2000 bucket in the P2M segment are happening in the organized categories.
P2P & P2M UPI transactions by Cr and Mn in AoV buckets
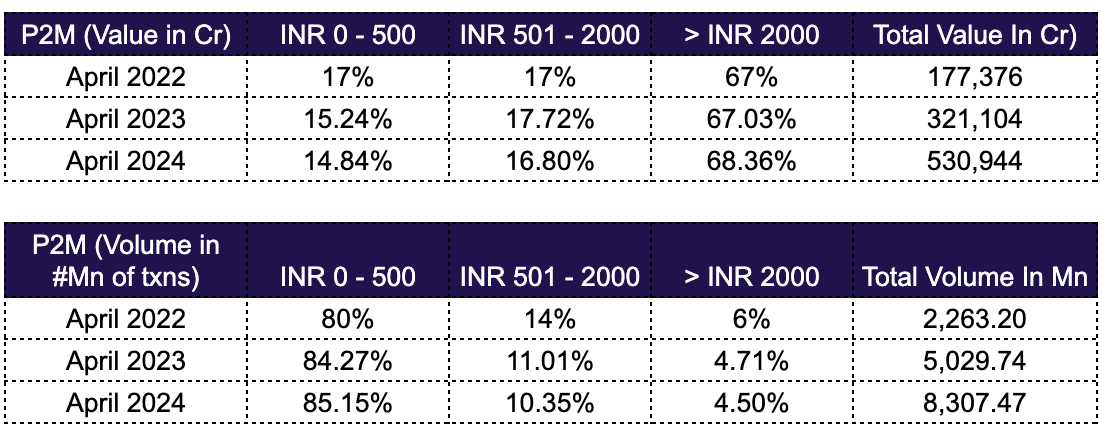
Here is the P2M Data:
For April ‘24, out of the ~27% of total UPI volumes that come from P2M, this is how they fall in transaction value buckets. In terms of # of transactions, P2M contributed to 62.44%.
Here is the P2P Data:
For April ‘24, out of the ~72% of total UPI volumes that come from P2P, this is how they fall in transaction value buckets. In terms of # of transactions, P2P contributed to a total of 37.5%.

And this is the AoV by transaction value bucket:

So what can be seen? Well:
For April ‘24 In P2M, 85% of transactions only account for 14.84% of the value --> this is the 0-500 txn bucket, and the AoV here is ~INR 111 in April 2024
For April ‘24 P2M While 4.50% of number of transactions account for 68.36% of Value --> this is the > 2000 bucket, and this has an AoV in April 2024 of ~9700
So even if we exclude the P2PM merchants, and just for the sake of being conservative, let’s say I take this to be both the INR 0-500, and the INR 501 - 2000 bucket, this still leaves ~68% of monthly value in Cr, or 4.5% in terms of number of transactions that NPCI can look to monetize to support the costs of UPI infrastructure.
What pricing model for UPI makes the most sense and allows break-even?
There are two models we can follow:
1) Charge a fixed fee per transaction: Global analogues are Blik and Swish. If only the transactions where the AoV > Rs 2000 is charged, then the fee per transaction would need to be Rs 15! But if the entire 8B of P2M transactions are charged, then a per transaction cost of Rs 0.67 would be enough to break-even. So to break-even, at a reasonable pricing, the P2PM merchant would be impacted
2) Charge a % per transaction: Global analogues are Pix (0.22% per transaction) and Twint (1.3% per transaction). If only the transactions where AoV > Rs 2000 is charged (which is ~INR 3.5 Lac Cr in April ‘24), then the fee per transaction would need to be 0.15%, and if the total P2M volumes are charged (which is ~5.3 Lac Cr in April ‘24), the fee per transaction would need to be 0.10%.
3) There is a 3rd option: Charging a subscription fee to the end customer on a per month basis: If we only charge the top 10% of users, this comes to a charge of Rs 180 / month, but if we charge the entire base of 300M customers, this comes to Rs 18 / month of subscription fees. And as more people join the UPI network, this cost will reduce.
Basis these calculations, it seems that a % per transaction seems to make more sense, and at 0.15% the P2PM merchant at current volumes will not need to be priced.
This table illustrates this well:

So what next for UPI pricing?
Well firstly: The per transaction fee only makes sense if the entire P2M landscape (including the P2PM merchant is charged), which is not something that NPCI wants to do basis historic behaviour. So if pricing does come into play, and if only the larger P2M merchant is priced, then a fee of 0.10% - 0.15% / transaction seems to make sense
If the goal for NPCI is to fragment the UPI App landscape and prevent the top 2-3 apps from controlling all the UPI market share, then pricing would need to be key. By bringing pricing in, suddenly apps aren’t operating at a loss, and there is more business incentive to actually challenge the incumbents: PhonePe, Gpay and Paytm.
But some more thought will have to happen on how to bring this pricing in (if it is brought in). One obvious fraud is organized merchants masquerading as unorganized to be able to avoid paying transaction fees.
The second problem that would need solving is, even if NPCI decides to bring pricing on UPI payments, how will that be introduced? Immediately? But then what about the market caps on 30% market share? If pricing comes in, then while it incentivizes new apps to move in, it also incentivizes incumbents to keep the share that they have. A solution could be: only allowing pricing upto 30% of the UPI market share, and volumes above 30% market share: be they Credit Cards, Credit Lines, or PPI on UPI cannot be charged. But more thought would be needed on how to introduce this.